
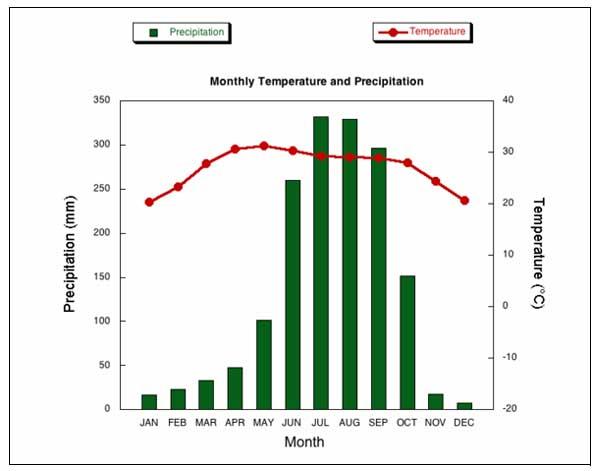
The bar graph provides information
of
Change preposition
about
average
monthly temperature. The line graph gives data Correct article usage
the average
of
Change preposition
on
average
monthly precipitation in Kolkata over a year.
We can see clearly that the figures for Correct article usage
the average
climate
fluctuate considerably. It is noticeable that the highest Use synonyms
rainfall
is from June to September as opposed to the highest Use synonyms
climate
is in April and May.
Use synonyms
According to
the bar chart, the Linking Words
rainfall
was just under 20 Use synonyms
mm
in January. It increased steadily and in June, the Use synonyms
rainfall
was twice as high as Use synonyms
May
. In July the Change preposition
in May
rainfall
reached a peak of around 340 Use synonyms
mm
and it started to fall down dramatically again from August and stood at well under 10 Use synonyms
mm
Use synonyms
on
December.
As shown in the line chart, the Change preposition
in
climate
rose considerably from January to May (approximately 30 C). It reduced until July and stabilized at about 27 Use synonyms
mm
. The Use synonyms
climate
increased steeply until December by roughly 20 C.Use synonyms