
The given pie charts illustrate
us
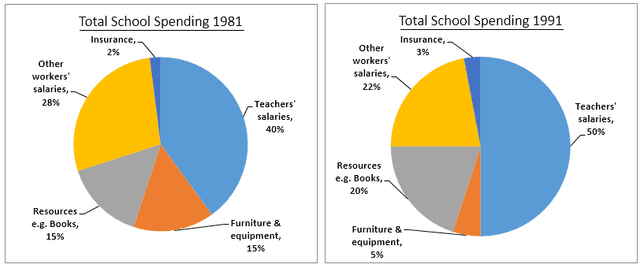
the data about the proportion of alteration that a special UK school spent in three years which were 1981, 1991 and 2001.
Change preposition
to us
Overall
, what stands out from the three charts Linking Words
are
that teacher Correct subject-verb agreement
is
salaries
were the highest expense Use synonyms
while
insurances were the lowest in all three years. Linking Words
Moreover
, the cost of insurance and furniture and other equipment increased, Linking Words
although
other worker Linking Words
salaries
and resources e.g. books declined slightly during the given years.
When Use synonyms
looked
at the graphs in detail, Wrong verb form
looking
rate
of teacher Correct article usage
the rate
salaries
made up approximately half of all the costs. Use synonyms
Fix the agreement mistake
Expenses
Expense
of insurance increased from 2% to %8 Add an article
The expense
in contrast
, resources fell Linking Words
down
between 1981 and 2001. Change preposition
apply
According to
the graphs Linking Words
furniture
and equipment ratio had Correct article usage
the furniture
flactuately
Correct your spelling
fluctuated
fluctuate
increasing
that it reached Wrong verb form
increased
to
a quarter of all costs in 2001. In 1981 other Change preposition
apply
worker
Fix the agreement mistake
workers
salaries
account for Use synonyms
near
a fourth of all spending, Change the word
nearly
however
, Linking Words
this
plunged to 15 % in 2001.Linking Words