
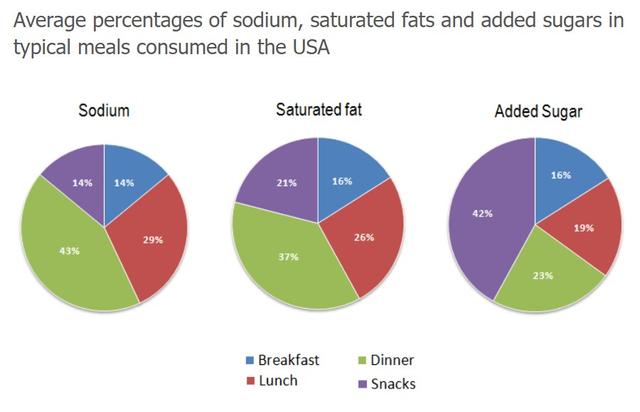
The pie charts illustrate the average proportion in routine meals of three kinds of nutrients which are not suitable for a healthy lifestyle in case of having them too much.
Overall
, added sugar is the most nutrient which Linking Words
people
in the USA eat, Use synonyms
whereas
they have more sodium and saturated fat in Linking Words
dinner
than any other meal.
Use synonyms
Firstly
, the highest amount in Linking Words
sodium
chart is occupied by eating sodium in Correct article usage
the sodium
dinner
, accounting for 43%, followed by lunch, at 29%. US Use synonyms
people
have the same percentage of Use synonyms
this
nutrient in breakfast and snacks, at 14%
Linking Words
Secondly
, the vast majority of eating saturated fat happens Linking Words
in
Change preposition
at
dinner
, with 37%. Use synonyms
While
Linking Words
this
type of nutrient is consumed nearly between Linking Words
in
snacks and lunch, breakfast is the meal which Change preposition
apply
people
eat the least of it, at 16%
Use synonyms
Finally
, consumption of added sugar in snacks is responsible for 42%, followed by Linking Words
dinner
and lunch, with 23% and 19% respectively, compared to eating saturated fat in breakfast, it is a similar proportion of Use synonyms
people
who have sugar in Use synonyms
this
meal.Linking Words