
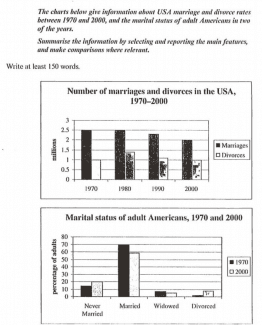
The first bar chart illustrates the figures for divorced and married people in the USA by 30 years,
while
the second chart shows the percentage of the marital status of adult Americans in 1970 and 2000.
It is worth mentioning that the number of marriages steadily decreased between 1970 and 2000, Linking Words
while
the figures for divorced adults have been fluctuating until the end of the period. The majority of Americans were married in both years, but by 2000 proportions of single people increased remarkably.
In the first chart, at the beginning of the Linking Words
period
there were 2.5 Add a comma
,period
million
marriages in America and 1 Use synonyms
million
divorces. After one decade the marriage stayed constant, Use synonyms
whereas
the divorce rate rose by 0.5 Linking Words
million
approximately before falling back to 1 Use synonyms
million
in 2000. Use synonyms
However
, between the two Linking Words
last
decades, the rate of marriages has been decreasing from 2.5 to 2 respectively.
At the beginning of the term, the percentage of married American people was about 70% and it marginally dropped to 60% in 2000. In the end, widowed citizens of the USA were lesser than in 1970. Linking Words
In contrast
, the proportion of single adults and divorcees experienced an increase of 10 % roughly.Linking Words