
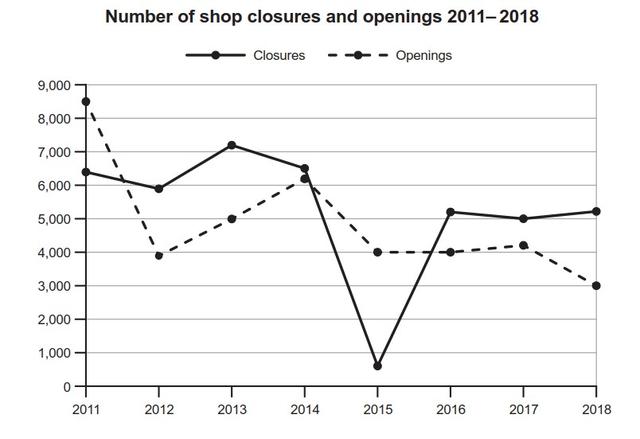
This
graph illustrates a comparison between the closure of Linking Words
shops
and the opening of new Use synonyms
shops
from 2011 to 2018.
Use synonyms
Overall
, there are multiple variations but, the most prominent feature is the reduction in the openings and closing down of new Linking Words
shops
in 2015. Use synonyms
Furthermore
, in 2014 the number of businesses shutting down and opening Linking Words
were
almost similar to each other.
In 2011, the closure of multiple businessesChange the verb form
was
Add a missing verb
was
However
, less than 1,000 Linking Words
shops
suspended their business which stood as the greatest decline seen over eight years. But, the trends were sharply rising until Use synonyms
it
levelled off in 2018.
The new openings had a steep drop from 2011 to 2012, when the number of openings was higher than 9,000 and 4,000, respectively. From 2015 to 2017, the trends Correct pronoun usage
they
finally
levelled off and took a minor decline in 2018.Linking Words