
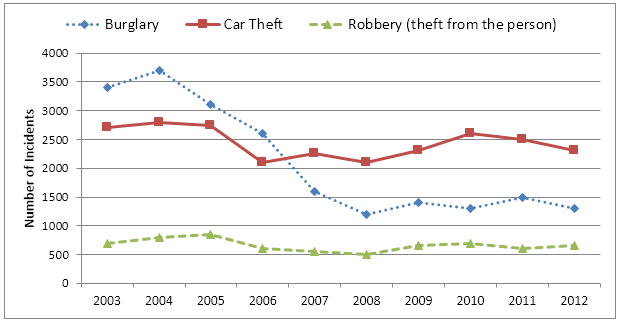
The line graph compares the number of crime incidents in Newport City over a 9-year
period
. In general, despite some fluctuations, it can be seen that all crime types declined over the Use synonyms
period
, most significantly for burglary crimes.
The first detail to note is that car theft and robbery had a similar pattern where they both only dropped slightly. They started from 2700 and 600 Use synonyms
cases
respectively in 2003 and experienced some fluctuation between 2005 and 2009. Use synonyms
At the end
of the Linking Words
period
, the number of people who took other people's cars decreased steadily where stopping at 2300 Use synonyms
cases
in 2012 Use synonyms
while
the robbery Linking Words
cases
finished the Use synonyms
period
at the same level at which it started.
In comparison, burglary Use synonyms
cases
experienced a dramatic fall over the years. Use synonyms
Although
it reached its peak in 2004 with nearly 3700 Linking Words
cases
, it was Use synonyms
then
followed by a steady decline until the end of the Linking Words
period
with only one-third of the initial case number.Use synonyms