The table and charts below give information on the police budget for 2017 and 2018 in one area of Britain. The table shows where the money came from and the charts show how it was distributed. Summarise the information by selecting and reporting the main features, and make comparisons where relevant.

The table and charts below give information on the police budget for 2017 and 2018 in one area of Britain. The table shows where the money came from and the charts show how it was distributed.

Summarise the information by selecting and reporting the main features, and make comparisons where relevant.
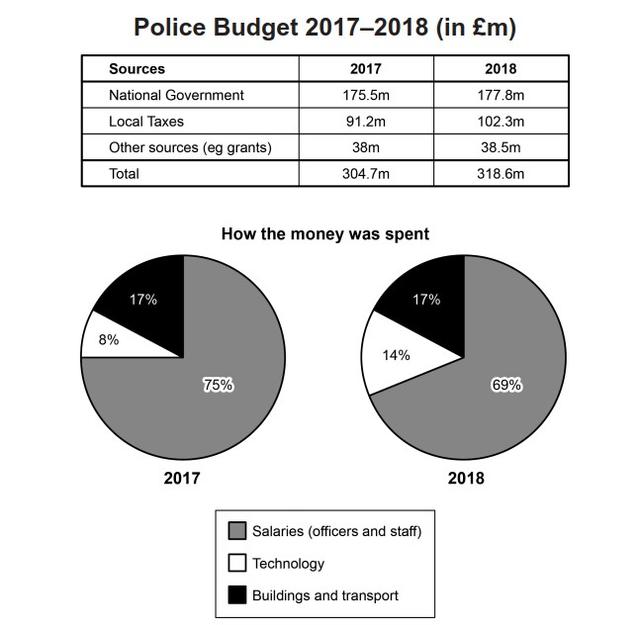
The table illustrates the data on the police accounts from which the money came and the two pie charts describe the distribution of the total apply wealth in two of the years 2017 and 2018 in an area of Britain.
Overall
, there was an upward trend in all three different sources
while
the capital spent on remuneration was always the majority of contribution. Looking into more details, the highest amount of money on the police budget belonged to 'National Government', 175,5 trillion in 2017 and it kept rising to IT.8 sum.
Then
was followed by 'Local Taxes', at 91.2 in 2017, after one year, it increase significantly to 102.3 million pounds. In terms of how the money was spent, the majority of the police budget goes on salaries of the officers and staff, dropping slightly from 75% in 2017 to 69% in 2018. Meanwhile, the proportion of 'Buildings and transport remained constant, at 17% each year. An opposite pattern can be seen in the category of technology, its figure rose sharply from 8% in 20 to 14% in 2018, which was always the lowest rate during the given period.
Submitted by patelnazu121 on

Unauthorized use and/or duplication of this material without express and written permission from this site鈥檚 author and/or owner is strictly prohibited. Excerpts and links may be used, provided that full and clear credit is given to Writing9 with appropriate and specific direction to the original content.

Topic Vocabulary:
  • Fiscal allocations
  • Revenue streams
  • Budgetary oversight
  • Expenditure
  • Financial appropriation
  • Government grants
  • Local taxation
  • Operational costs
  • Capital investment
  • Public safety
  • Crime prevention
  • Community policing
  • Resource allocation
  • Year-on-year comparison
  • Budgetary constraints
  • Fiscal year
  • Fund disbursement
  • Budget deficit/surplus
  • Trend analysis
  • Financial sustainability
  • Law enforcement funding
What to do next:
Look at other essays: