
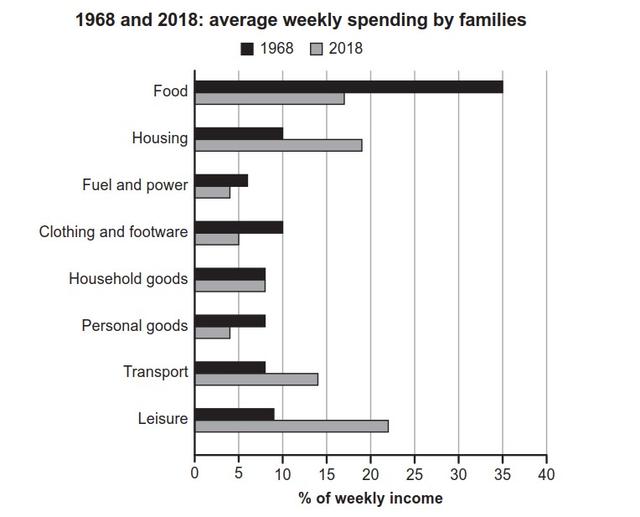
The provided chart illustrates the proportions of average weekly spending by families in one nation, in 1968 and 2018.
Overall
, in 1968 majority of income was spent on food Linking Words
while
in 2018, it was on leisure activities. Despite that, expenditure on household goods stood at the same figure in both years.
In 1968, these families spent the same proportion of money which is 10% on housing and clothing. Linking Words
Similarly
, an equal percentage for household goods, personal equipment and transportation( approximately 8%). Fuel and power were the least concern in 1968 as they accounted for only around 6%. Linking Words
However
, for leisure activities, they spent closer to 10% of their income in the year 1968.
Linking Words
On the other hand
, in 2018 closer to 5% of the money was spent on personal equipment and fuel which is less than the percentage spent on clothing and footwear. Linking Words
Also
, all of those three had higher percentages in 1968. Linking Words
Furthermore
, the cost of transport, housing and leisure increased by nearly 14%,18% and 22% respectively in 2018 compared to 1968. Linking Words
Finally
, expenses for food were reduced dramatically in 2018.Linking Words