
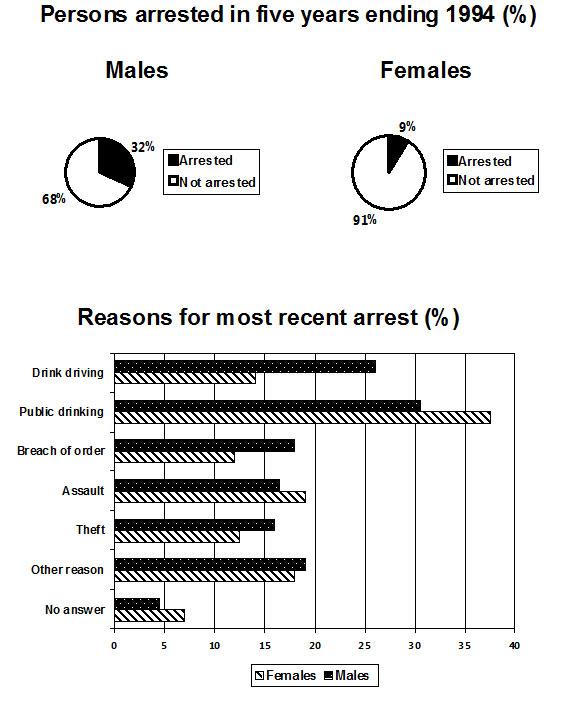
The pie charts provide information about the proportion of people who died in 2 different genders in five years ending 1994 order, theft,
while
the bar chart reveals the major reasons why they passed out. Linking Words
Overall
, Linking Words
men
who are still alive were less than Use synonyms
women
and public drinking is the highest way affecting death.
Use synonyms
According to
the data, there were several causes of death. The most reason was taken by public drinking causing the death of both Linking Words
men
and Use synonyms
women
, contributing 31% and 37% respectively. Drinking driving, breach ofUse synonyms
Add an article
the
an
as well as
other reason influenced more dead Linking Words
men
than Use synonyms
women
. They registered more than 15% for Use synonyms
men
with the exception of drinking Use synonyms
while
driving with 26%. Linking Words
Although
assault and no answer Linking Words
as well as
public drinking caused more dead females, nearly 20% of Linking Words
women
were killed and only 7% of these were with no answer.
Use synonyms
On the other hand
, it can be clearly seen that over the period, there Linking Words
was
32% Change the verb form
were
males
passed out , Change preposition
of males
Linking Words
however
the percentage of arrested females was a mere 9%.Add a comma
,however