
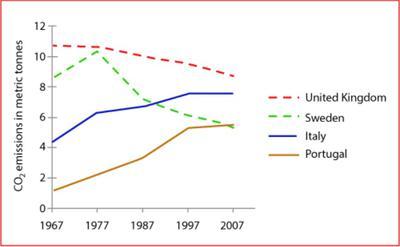
The line graph gives information about the amount of
carbon
Use synonyms
dioxide
(CO2) emitted per capita on average in 4 countries from 1967 to 2007. Use synonyms
Overall
, the average Linking Words
carbon
Use synonyms
dioxide
emissions per person in the UK and Sweden experienced a downward trend, Use synonyms
while
there was an upward trend of Linking Words
carbon
emitted per capita in Italy and Portugal over the period given.
In 1967, Use synonyms
carbon
Use synonyms
dioxide
(CO2) emitted by the UK and Sweden on average was over 10 and above 8 metric Use synonyms
tonnes
, respectively. The UK’s emissions remained relatively constant until 1977 and Use synonyms
then
decreased gradually to reach around 8.5 metric Linking Words
tonnes
in 2007. In the meantime, the amount of CO2 emitted by the Swedish increased slightly to over 10 metric Use synonyms
tonnes
in 1977. After that, it showed a rapid drop to around 6.5 metric Use synonyms
tonnes
in 1987 and Use synonyms
then
continually declined and reached its lowest point at around 4.5 metric Linking Words
tonnes
.
Use synonyms
On the other hand
, the average Linking Words
carbon
Use synonyms
dioxide
emission from Portuguese and Italian in 1967 accounted for less than 2 and just over 4 metric Use synonyms
tonnes
, respectively. After that, there was an upward trend until 1997. Use synonyms
Then
, the average Linking Words
carbon
Use synonyms
dioxide
emitted by those 2 countries remain constant until 2007, with CO2 from Portugal, remaining the lowest and the UK still being the highest after 40 years from the beginning of the period given.Use synonyms