
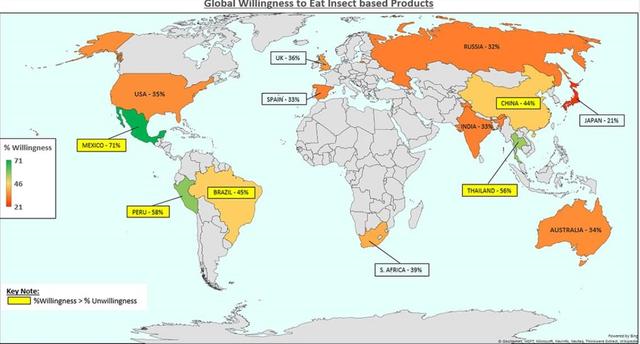
The given diagrams illustrate the desire of people to consume insect products and the cost of some commodities sold on the market.
As can be seen from the map, the least popular insect products are in Russia, India, the USA,Japan,Spain, Africa,the UK and Australia, where the proportion is fluctuating from 21% to 36%. China and Brazil,
however
, are second highest with 44% and 45% respectively. The majority of aforementioned goods are going to be consumed in Peru,Mexico and Thailand, where the percentage is varying from 56% to 71%.
Turning to the bar chart, the most costly and profitable across the whole market is Weaver Ant, with the price decreasing significantly to the rice ( 10.65 Linking Words
USD
/Use synonyms
kg
and 0.78 Use synonyms
USD
/Use synonyms
kg
correspondingly).Looking into details, beef is the most expensive among meats, in sharp contrast to chicken (3.03 and 1.08 Use synonyms
accordingly
). It is Linking Words
also
worth noting ,that wild species are more pricy than bred ones.
Linking Words
Overall
, the most ready-to-consume insect products are in Peru(71%) and the least in Japan(21%). Linking Words
According to
the graph, the cheapest product is Rice(0.78 Linking Words
USD
/Use synonyms
kg
) Use synonyms
while
the cost of wild Weaver Ants is astronomical(10.65 Linking Words
USD
/Use synonyms
KG
).Use synonyms