
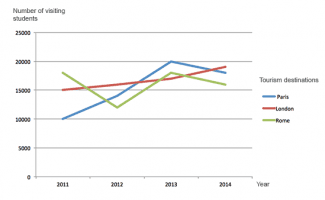
The assigned line chart illustrates the information about the tourism statistic among Veneueliam beginners from 2011 to 2014. The
Vartical
axis shows the numbers and the Horizontal axis Correct your spelling
Vertical
show
the years.
Correct subject-verb agreement
shows
Overall
, It is lucid that, the average number of Linking Words
students
tourism destinations in Rome shows an upward trend. Change noun form
students'
student's
However
, the downward trend which Linking Words
wse
followed by the freshers, who Correct your spelling
was
were
visited Unnecessary verb
apply
by
Paris and London.
At a fleeting glance, it is immensely that, the Change preposition
apply
students
who were visiting in 2011 was 10000. It was the Correct quantifier usage
number of students
most
lowest number in Paris and Change the adjective
apply
then
climbed dramatically throughout the period. After that, rose slightly Linking Words
around
18000 in 2014. Change preposition
to around
Moreover
, in the same Linking Words
year
2011, the Use synonyms
amount
of students visiting was 15000 in London, Change the quantifier
number
while
it Linking Words
was
continuously increased in the Unnecessary verb
apply
last
2013 and Linking Words
then
grew up slowly Linking Words
nearby
19000 in the later Correct your spelling
nearly
year
.
Use synonyms
Further
scrutinizing the chart, the tourism destination was visiting Rome in the former Linking Words
year
, and freshers were nearby 18000, whilst, it Use synonyms
was
decreased sharply between 10000 to 15000 in 2012, whilst in the same Unnecessary verb
apply
year
, it Use synonyms
was
again increased suddenly about 17000 in the next Unnecessary verb
apply
year
and Use synonyms
then
declined drastically less than 18000in the given period of time.Linking Words