
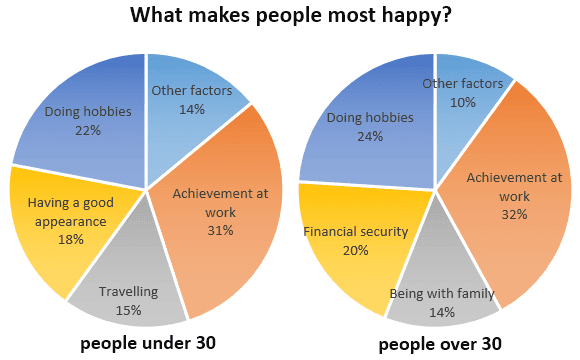
The chart shows what makes people happy mostly. The information is separated into two different groups which are under 30 and upper 30.
Initially
, in both groups, the ratio of achievement at work was quite similar (approximately 31-32%). Linking Words
Also
, the other subject, which is called ''doing hobbies'', is close to each other too (roughly 23%).
Whilst, people who are under 30 years old care about having a good appearance, individuals who are over 30 years old are concerning financial security. In both age gaps, those data are a bit the same (19%). Linking Words
On the other hand
, those under Linking Words
the
30s are paying attention to travel rather than being with a family. The proportion of ''the other factors'' is 14% for those under thirty-somethings and Change the word
their
moreover
, it is 10% for those Linking Words
over
Change preposition
in
the
30s.
Change the word
their
To sum up
, with regard to ''doing hobbies'' and ''achievement at work'', those are a bit essential for both ages. Linking Words
However
, the younger generations are feeling happy Linking Words
link
to travel activities and having a good appearance than a person who is over thirty-somethings.Replace the word
linked