
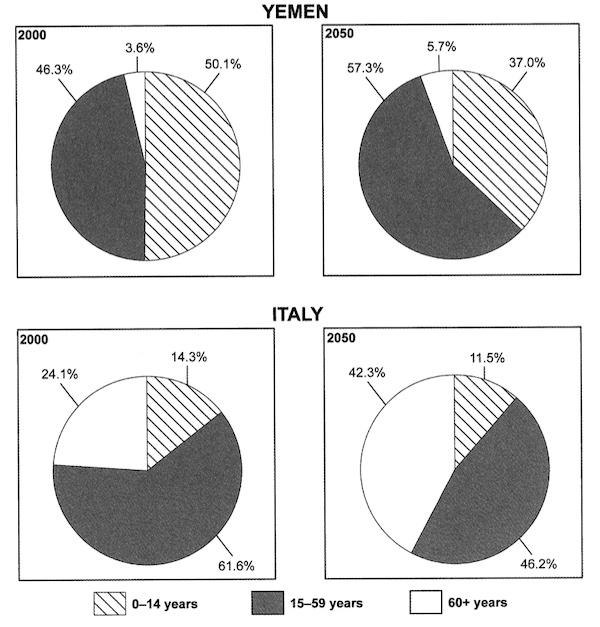
Given are four pie charts which indicate the different ages of the population of Yemen and Italy in 2000 and 2050 . It is obvious that the majority of people , except Yeman in 2000 , the three rest of the components are composed by the age of 15-59.
To look closely at these figures, in 2000, the children which were 0-14
years
old held the most,with a proportion of 50.1% , more than half , yet is expected to decrease by 13.1% in the future 2050.For 15-59 Use synonyms
years
old , 46.3% was in 2000 , increase the percentage to 57.3% in the year 2050 . Use synonyms
However
, the least number , for those over 60 Linking Words
years
old , remains the Use synonyms
last
at 3.6% and 5.7% , climbing a bit in 2050.
Linking Words
Morover
, for Italy's studies , the biggest proportion in both Correct your spelling
Moreover
years
is middle age , 61.6 and 46.2 in 2000 and 2050 relatively . The youngsters of 0-14 Use synonyms
years
old , fluctuated Use synonyms
2.8
% to 11.5% in the later 50 Change preposition
from 2.8
years
. The Use synonyms
last
figure which is above the 60s has a noticeable rise from 24.1 to 42.3% ,almost double the pie graph.Linking Words