
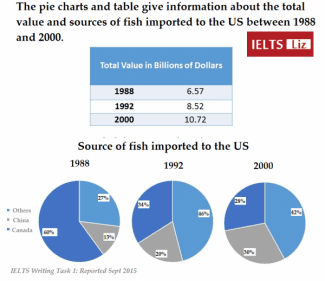
The table and pie chart compares the amount of income and sources of
the
Correct article usage
apply
fish
imported to the US over 12 years from 1988 to 2000.
Use synonyms
Overall
, it is clearly observed that Linking Words
tbe
highest total value of Correct your spelling
the
fish
imported is in 2000 and the lowest importation is in 1988. Use synonyms
While
the Linking Words
the
country that Remove the redundancy
apply
fish
had imported mostly from Canada at early and had dropped Use synonyms
drammatically
Correct your spelling
dramatically
in
the end of time Change the preposition
at
fram
and in china grew Correct your spelling
frame
consistantly
.
Starting with, 10.72 billion dollars in 2000, represented the vast majority of profit, followed by 8.52 and 6.57 billion dollars in the year Correct your spelling
consistently
of
1992 and 1988, respectively.
With regard to, the country of Change preposition
apply
fish
imported to the US illustrates that in Use synonyms
the
1988 at 60% was the large percentage among other counties and dropped considerably in 2000 Change the article
apply
at
28%. Interestingly, the number of Change preposition
to
fish
imported from others increased drastically in 2 years given by 27% in 1988, and 65% in 1992, and slightly declined in 2000 to 42%Use synonyms