
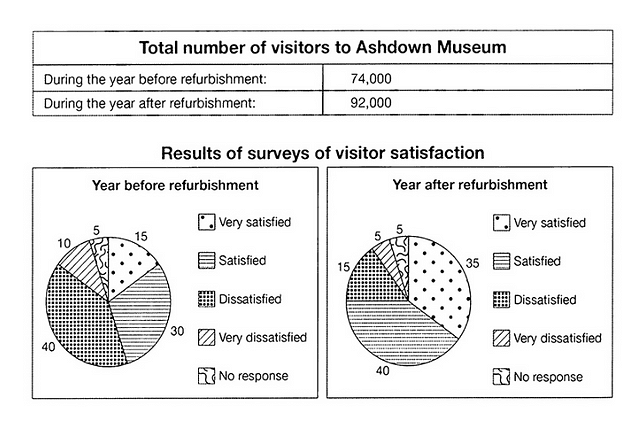
The table and pie charts compare the outcome of surveys about how satisfied
visitors
Use synonyms
and
the number of Add a missing verb
are and
visitors
at Ashdown Museum during the Use synonyms
year
before and after renovation.
Use synonyms
overall
, it is clearly observed that the number of Linking Words
visitors
to the museum increases dramatically after the refurbishment process, and Use synonyms
accordingly
to the satisfaction consequences after the Linking Words
year
,refurbishment the percentage of satisfied have grown slightly.
Starting with, the Use synonyms
visitors
' proportion during the pre-renovation at solely 74,000 people. Interestingly, post-renovation climb up to 18,000 or 92,000 people.
With regard to, satisfaction consequences show a significant change throughout the time frame. As the result, it is can be seen that the percentage of dissatisfied decline considerably in the Use synonyms
year
after refurbishment from 40% to only 15%. On the other ,hand the very satisfied sector is the vast majority of proportion in the Use synonyms
year
after renovation accounting for 35% and followed by satisfied, and dissatisfied, at 40% anUse synonyms