
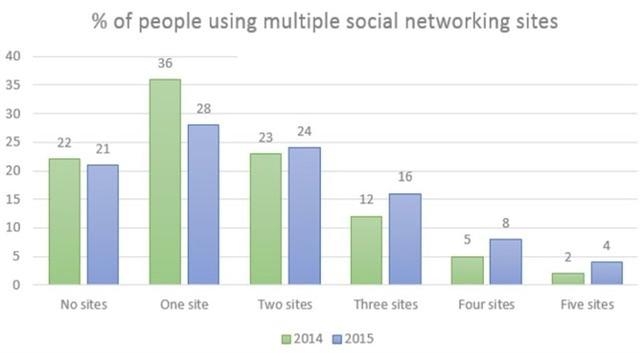
The bar chart compares the situation of using social media
sites
of Use synonyms
people
in Canada in the years 2014 and 2015.
Use synonyms
It is clear that
in 2014 more Linking Words
people
used a maximum of one Internet site Use synonyms
while
they have been used surfing on more than Linking Words
two
Websites in 2015.
2014 saw 36% of inhabitants in Canada using only one site, followed by 23% of them having Use synonyms
two
networking Use synonyms
sites
. Use synonyms
However
, the figure for using one site dropped significantly in 2015, by 8%. In 2014, Linking Words
people
using three or more Use synonyms
sites
were under 20% in total.
Use synonyms
On the other hand
, an Linking Words
overall
increase in the proportion of Linking Words
people
using more than Use synonyms
two
Use synonyms
sites
could be seen in 2015. Apparently, the percentage of Use synonyms
people
who use three social networking Use synonyms
sites
rose to 16%, compared with the figure of 12% in 2014. Use synonyms
Also
, there were roses by about 2% in the population using Linking Words
two
, four and five Use synonyms
sites
.Use synonyms