
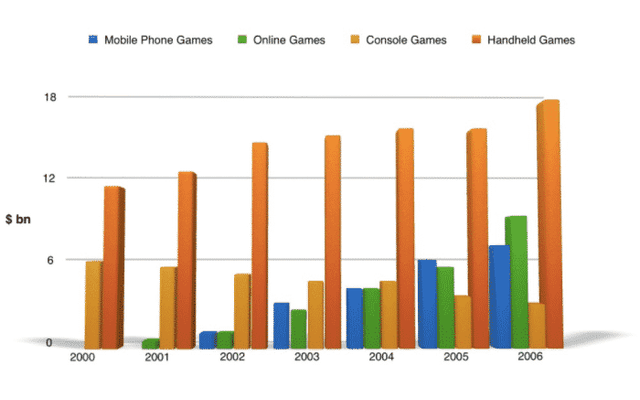
The bar chart illustrates the worldwide sales of mobile phones,online,console and handheld
games
in the period between 2000 and 2006.
Use synonyms
Overall
,the chart is measured in billions.At the start of,2000 there were only Linking Words
two
kinds of Use synonyms
games
:handheld and console.Use synonyms
However
,with the development of technologies,in the Linking Words
last
,Linking Words
year
we can see all four of them.The biggest difference between them was in 2002.
Use synonyms
Firstly
,as applicable was mentioned,in 2000 there were only console and handheld Linking Words
games
.Use synonyms
However
,in the next Linking Words
two
years mobile and online Use synonyms
games
joined apply them.At the,start the Use synonyms
number
of console Use synonyms
games
was 6 Use synonyms
billion
and a handheld's-little bit less than 12.Use synonyms
However
,next years both of them had significant changes.Console Linking Words
games
started to fall and did it till the end.In 2006 their Use synonyms
number
was about 3 Use synonyms
billion
,Use synonyms
while
the Linking Words
number
of handheld Use synonyms
games
' amount was becoming bigger and bigger from Use synonyms
year
to Use synonyms
year
.In the,end it rose to almost 18 Use synonyms
billion
in sales.Use synonyms
Secondly
,Linking Words
two
other kinds of Use synonyms
games
:mobile and online,started from about 1 Use synonyms
billion
.In 2002 they had a gentel rise.Use synonyms
However
,in 2003 the Linking Words
number
of mobile Use synonyms
games
was higher than online ones.Use synonyms
Besides
in the next Linking Words
year
they were equiel again.For next Use synonyms
two
years their Use synonyms
number
continued to decrease and did it till the end.In 2006 the Use synonyms
number
of phone Use synonyms
games
was about 7 billions and the online's Use synonyms
number
was about 9 billions.Use synonyms