
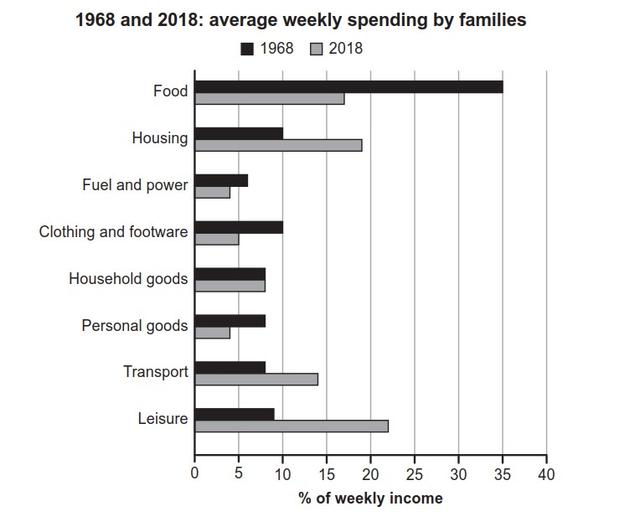
The chart provides household expenditure of a week's revenue in a state in two different periods (1968 and 2018). Generally, there was a portion shifting of expenditure over fifty years where the allocation of food spending was replaced by leisure expenses as the highest cost of families’ life.
Furthermore
, the allotment for housing and transport had a significant increase, and the rest of spending excluding household goods was recorded to decrease.
Take a closer look at the bar chart, the percentage of leisure expenses surged sharply from nearly 10% to about 22% in 2018. Linking Words
Therefore
, it made leisure has been the highest portion of spending, followed by food and housing as the top three expenditures in 2018. Linking Words
On the other hand
, there was only less than half as much food cost share in 2018 as there had been in 1968. For the record, It dropped by approximately 19% to about 16% over a half-decade. As we can see, both housing and transport proportions almost doubled after five years. Linking Words
Moreover
, housing contributed from 10% to almost 20%, Linking Words
whereas
transport made up from below 10% to about 14% in 2008. On the other side, there was a decline in fuel power cost from 6% to 4%, Linking Words
also
personal good spending dropped from around 8% to only a half of it. Linking Words
Thus
, the household goods share has a similar portion abou8-9% of total spending.Linking Words