
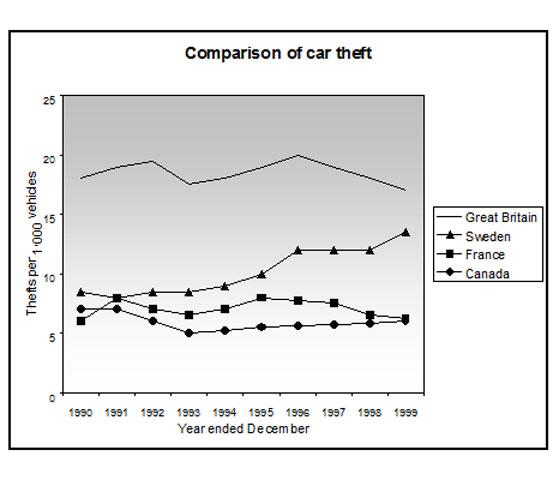
The line graph above illustrates the
number
of Use synonyms
thefts
for every Use synonyms
thousand
Use synonyms
vehicles
in 4 different countries over a decade, from 1990 to 1999.
Use synonyms
Overall
, over the course of 10 Linking Words
years
, Great Use synonyms
Britain
remains the country that has the highest Use synonyms
number
of people who steals Use synonyms
vehicles
. For the majority of the period, Canada is the country that has the lowest Use synonyms
thefts
per Use synonyms
thousand
Use synonyms
vehicles
.
With regards to the trend for Great Use synonyms
Britain
, every 4 Use synonyms
years
, the Use synonyms
number
of Use synonyms
thefts
reaches its peak and starts to drop again. It started from approximately 17,000 to 20,000, in 1990 to 1993 respectively, and declined in 1994 to about 16,000. It repeated the trend in the next four Use synonyms
years
. Regardless, the Use synonyms
number
of Use synonyms
thefts
in Great Use synonyms
Britain
for every Use synonyms
thousand
Use synonyms
vehicles
never exceed 20,000 nor was it lower than 15,000 in the period between 1990 and 1999.
Use synonyms
While
the other countries to Linking Words
seem
fluctuate, Sweden was only unstable in the first 3 Add the particle
toseem
years
, starting at about 8,000 and dropping to nearly 6,000 in 1991. It started to rise again and stopped increasing from 1996 to 1998, staying the same at about 12,000.
In 1999, Use synonyms
while
France seemed to stay the same at approximately 6,000, Canada and Sweden's Linking Words
number
of Use synonyms
thefts
per Use synonyms
thousand
Use synonyms
vehicles
had a rising trend, Use synonyms
whereas
Great Linking Words
Britain
tended to decline.Use synonyms