The graph shows average carbon dioxide (co2) emissions per person in the United Kingdom, Sweden, Italy and Portugal between 1967 and 2007.

The graph shows average carbon dioxide (co2) emissions per person in the United Kingdom, Sweden, Italy and Portugal between 1967 and 2007.
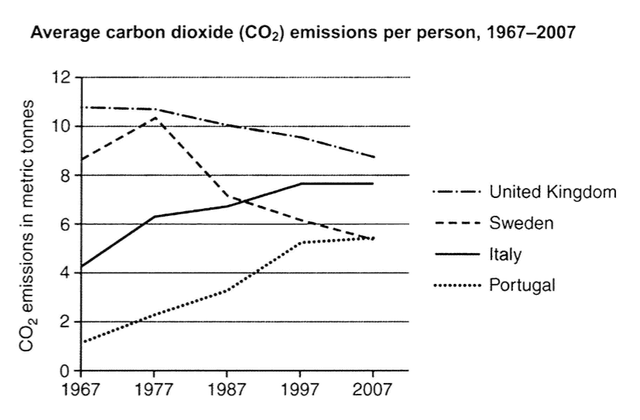
The line graph illustrates in the media the carbon dioxide discharge per individual in three countries in Europe from 1967 to 2007.
Overall
,
whereas
throughout the years, the United Kingdom and Sweden saw a decrease, Italy and Portugal had an increase in C02 emissions. Portuguese are the population that produces less Co2 emission. From 1967 to 1997, Sweden and Italy rose significantly in their emission, just over about 8 and 6 metric
tonnes
, respectively. From that year,
while
Italy continued a steady increase and reached just under 8 metric
tonnes
plateau in 1997 to 2007, the Swedish population continued a dramatic fall and lowered its carbon emissions to less than 6 metric
tonnes
in 2007. Portugal saw a constant rise from 1967 to 1997 ,
subsequently
reaching a plateau of under 6 metric tons. Even though the UK produces more CO2 emissions of more than 10 metric
tonnes
compared to the other 3, throughout the year it just decrease and reached just over 8 in 2007.
Submitted by arlindanobredeceita on

Unauthorized use and/or duplication of this material without express and written permission from this site’s author and/or owner is strictly prohibited. Excerpts and links may be used, provided that full and clear credit is given to Writing9 with appropriate and specific direction to the original content.

Sentences: Add more complex sentences.
Vocabulary: Replace the words tonnes with synonyms.
Vocabulary: Rephrase the word "undefined" in your introduction.
Vocabulary: The word "decrease" was used 2 times.
Vocabulary: The word "increase" was used 2 times.
Vocabulary: The word "plateau" was used 2 times.
Vocabulary: The word "reached" was used 2 times.
Vocabulary: The word "just over" was used 2 times.
Topic Vocabulary:
  • carbon dioxide emissions
  • per person
  • United Kingdom
  • Sweden
  • Italy
  • Portugal
  • graph
  • compare
  • average
  • increase
  • decrease
  • trend
  • peak
  • decline
  • years
  • period
What to do next:
Look at other essays: