
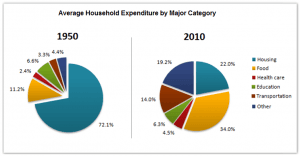
The assigned pie charts illustrate the information about the average household
spend
in a nation in 1950 and 2010.
Replace the word
spending
Overall
, it is lucid that, the ratio of housing, food, transportation and others were very different in 1950 from those in 2010.
At a fleeting glance, it is crystal clear thatLinking Words
,
the biggest chunk was taken by housing with 72.1% in 1950. Remove the comma
apply
while
the proportion slightly decreased by 22% in 2010. Linking Words
Moreover
, health care took the smallest chunk with 24% in the 20th century . Linking Words
Whereas
, the ratio minimally increased by 4.3% in the 21st century . It was interesting to note that, education remained the same with 6.5% and 6.3% in 1950 and 2010 respectively .
Linking Words
Further
scrutinizing the charts, the second highest production of food was 11.21% in 1950. Linking Words
whilest
, the percentage rapidly climbed Correct your spelling
while
with
32.0%. Change preposition
to
However
, transportation was the lowest production and the ratio was 3.3% in the same year. Linking Words
while
, in 2010, the portion steadily grew Linking Words
with
14%.Change preposition
by