
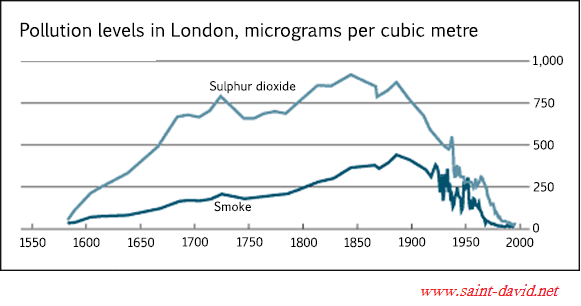
The graph illustrates the amount of pollution from
sulphur
Use synonyms
dioxide
and smoke in London from 1600 to 2000.
Use synonyms
Overall
, Linking Words
sulphur
Use synonyms
dioxide
dominated the highest toxicity levels in London of all time in Use synonyms
this
period. Linking Words
However
, the content of smoke was once higher than Linking Words
sulphur
Use synonyms
dioxide
in 1950.
Looking into the details, it could be observed that Use synonyms
sulphur
Use synonyms
dioxide
experienced a dramatic upward trend starting from around 0 Use synonyms
micrograms
before 1600 to approximately 750 Use synonyms
micrograms
after 1750. It had been continuing increase until reached the highest point of around 800 Use synonyms
micrograms
before 1850 and Use synonyms
lastly
remarkably decreased to almost 0 again Linking Words
at the end
of the period.
Linking Words
Likewise
, before 1600, the smoke made up roughly 0 Linking Words
micrograms
and experienced a slight increase of around 250 Use synonyms
micrograms
in the next two hundred years. After that, there was considerable growth with approximately 300 Use synonyms
micrograms
before 1900 and followed by a remarkable plummet to the bottom at 0 Use synonyms
micrograms
prior to the year 2000.Use synonyms