
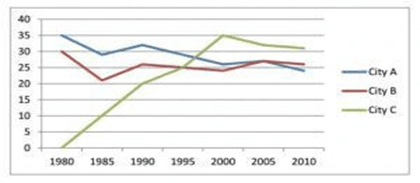
This
line graph illustrates the data Linking Words
of
international Change preposition
from
conferences
between 1980 and 2010 in three Use synonyms
cities
. Use synonyms
Overall
, it is clear from the graph that the number of Linking Words
conferences
in Use synonyms
City
Use synonyms
C
increased until 2000, Use synonyms
while
those in Linking Words
Cities
A and Use synonyms
B
fluctuated during Use synonyms
this
period.
Linking Words
According to
what is shown, from 1980 to 1985, there was a significant decrease for both Linking Words
cities
A and Use synonyms
B
of around 29 and 21, respectively, in originating Use synonyms
conferences
, Use synonyms
whereas
in Linking Words
city
Use synonyms
C
, it rose quickly by 20. Use synonyms
In addition
, in 2005, Linking Words
cities
A and Use synonyms
B
held an equal number of Use synonyms
conferences
, Use synonyms
that is
around 27.
Linking Words
However
, they organized the Linking Words
conferences
in Use synonyms
city
Use synonyms
C
, which saw a huge increase between 1990 and 2000, by exactly 25 and 35, respectively. In 2005, there was a gradual decline in Use synonyms
city
Use synonyms
C
of more than 30. Use synonyms
Moreover
, the number of Linking Words
conferences
was moderately reduced by just over 30.
Use synonyms
To sum up
, we could say that Linking Words
city
Use synonyms
C
was Use synonyms
more
preferred Correct quantifier usage
apply
than
Change preposition
over
cities
A and Use synonyms
B
for the management of Use synonyms
conferences
over the past 30 years.Use synonyms