
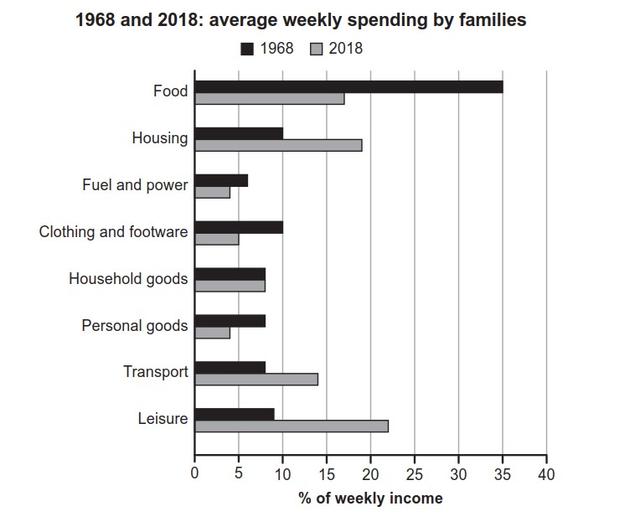
The bar chart illustrates how the weekly household budget was allocated in a specific nation in the years 1968 and 2018.
Overall
, it is apparent that the money spent on food each week used to account for the largest proportion in 1968, Linking Words
however
, it was overtaken by average weekly spending on entertainment in 2018. Linking Words
Additionally
, the percentage of expenditure on fuel and energy always ranked the lowest in the period shown.
Between 1968 and 2018, a plunge could clearly be seen in the amount of money distributed to food, where the figure dramatically shrank by approximately 20% over 50 years. Linking Words
Similarly
, the expenditure on clothes and shoes and personal commodities Linking Words
also
decreased, but much less significant than that of food ( from 10% in 1968 to 5% in 2018 of the total weekly budget and from about 8% to 4% respectively)
Linking Words
By contrast
, the spending on houses and transportation every week saw an increment in Linking Words
this
period, with the former roughly twice as high as it used to be (around 20%) and the latter close to 15% in 2018. More striking is that the amount of weekly budget spent on leisure grew remarkably, from less than 10% in 1968 to more than 20% in 2018. The only exception without growth or decline was the figure for domestic merchandise, which maintained stable at around 8% in those two years.Linking Words