
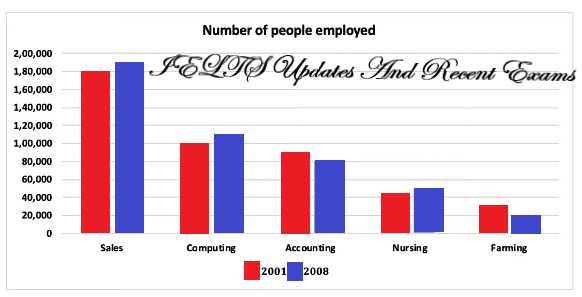
The given bar chart compares the
employees
in 5 fields of work in an undefined area in Australia in 2 different years: 2001 and 2008.
In general, Use synonyms
people
who worked as sellers were Use synonyms
highest
, Correct article usage
the highest
while
the lowest number of Linking Words
employees
is farmers. Use synonyms
Moreover
, the changes between 2001 and 2008 were insignificant.
In the field of sales, there were more than 150000 individuals who were selling goods in 2001, Linking Words
this
figure increased to around 165000 Linking Words
employees
in 2008, and the number of Use synonyms
people
employed in sales was the highest figure in both years. Use synonyms
By contrast
, the number of farmers in 2001 was the lowest figure in Linking Words
this
chart, there were about 20000 Linking Words
people
Use synonyms
worked
in Wrong verb form
working
this
field and decreased minimally in 2008.
Linking Words
People
who worked as accounters were 60000 Use synonyms
employees
in 2001 and stayed unchanged in 2008. The numbers of Use synonyms
people
who worked in Use synonyms
computing
and nursing fields were equal at around 50000 Correct article usage
the computing
employees
in 2001, and there was a moderate increase in Use synonyms
Linking Words
this
two fields to reach about 65000 and 60000 Correct determiner usage
these
people
respectively in 2008.Use synonyms