The chart below shows the number of trips made by children in one country in 1990 and 2010 to travel to and from school using different modes of transport. Summarise the information by selecting and reporting the main features, and make comparisons where relevant. test question

The chart below shows the number of trips made by children in one country in 1990 and 2010 to travel to and from school using different modes of transport. Summarise the information by selecting and reporting the main features, and make comparisons where relevant.  test question
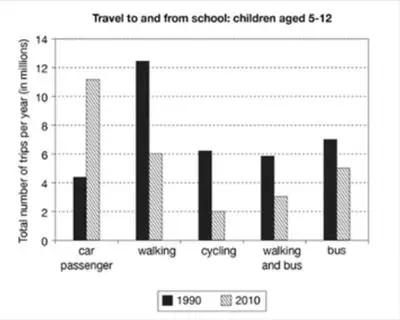
The following illustration demonstrates the sum of trips made by youngsters in one country in the years 1990 and 2010 to get to school using many types of transportation.
Overall
, it can be easily seen that walking was the most popular way to get around
while
cycling is the most unpopular among other categories.
To begin
with , car passengers had the lowest rate in 1990 at around 4 million by 2010 it skyrocketed to 11 million users.
Furthermore
, buses and walking and bus were all the same in the year 1990 in regions of 6 million.Cycling dramatically dropped one-third compared to 1990.
However
, in 2010 they all cut down
similarly
by half. In conclusion, in the past children used walking as the main way to get to their destination . In the next ,century students used cars more often . Other methods like buses and cycling declined throughout the years.
Submitted by alikocak74 on

Unauthorized use and/or duplication of this material without express and written permission from this site’s author and/or owner is strictly prohibited. Excerpts and links may be used, provided that full and clear credit is given to Writing9 with appropriate and specific direction to the original content.

Sentences: Add more complex sentences.
Introduction: The introduction is missing.
Introduction: Change the first sentence in the introduction.
Conclusion: The conclusion is too long.
Introduction: The chart intro is missing.
Basic structure: Change the first paragraph.
Introduction: The chart intro is missing.
Vocabulary: Only 5 basic words for charts were used.
Vocabulary: The word "around" was used 2 times.
Vocabulary: Use several vocabularies to present the data in the first paragraph.
What to do next:
Look at other essays: