
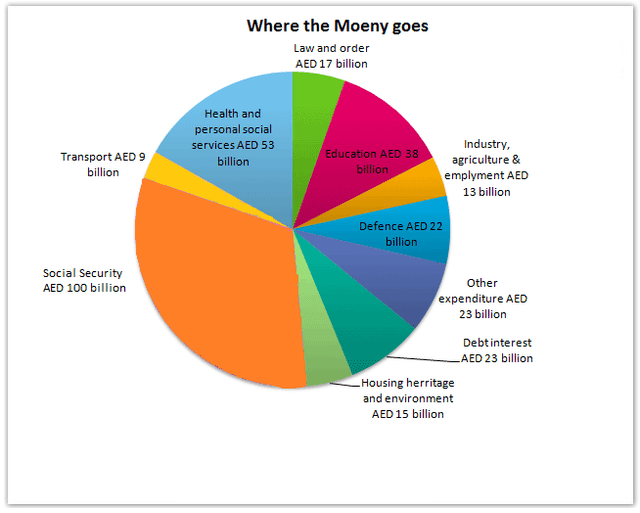
The given graph illustrates the expenditure of UAE authority in the year 2000. Looking from an
overall
perspective, it seems evident that social security accounted for the predominant share of the total budget( 315 Linking Words
billion
) Use synonyms
while
the opposite figure can be seen in transport.
Regarding the chart, there were 100 Linking Words
billion
AED spent on social security, more than a quarter, Use synonyms
whereas
transport took up just 9 Linking Words
billion
, much lower than the former one. Use synonyms
In addition
, the three categories law and order, industry, agriculture and employment, housing the heritage and environment had a similar amount of money, which were 17, 13 and 15 Linking Words
billion
respectively.
Turning to the other features, spending on health and personal social services was the second greatest on the chart, with 53 Use synonyms
billion
AED, higher than education by 15 Use synonyms
billion
. There were 22 Use synonyms
billion
for defence, which was followed by dept interest with 1 Use synonyms
billion
higher than that. Use synonyms
Lastly
, another expenditure was relatively considerable with 23 Linking Words
billion
AED.Use synonyms