
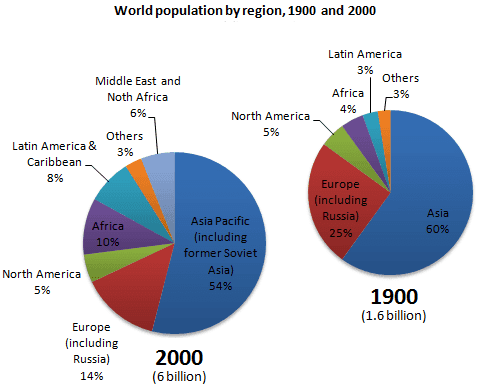
The given pie chart illustrates how the world
population
increases and decreases from the year 1900 to 2000.
Use synonyms
Overall
, the two pie charts show the Linking Words
population
which dramatically increased in 1 century Use synonyms
by
1.6 billion in 1900 to 6 billion in 2000.
We can see a rapid decrement in Europe including Russia, Asia, Change preposition
from
Africa
, and Latin America with the Caribbean. Europe including Russia's Use synonyms
population
rapidly falls from 25% to 14%, Asia steadily falls from 60% to 54%, Use synonyms
Africa
slightly falls from 10% to 4%,and Latin America from 8% to 3% in the years 1900 to 2000.
Use synonyms
Whereas
Linking Words
,
North America and others remain constant with a Remove the comma
apply
population
of 5% and 3% and in the year 1900 there is no middle East with North Use synonyms
Africa
was found in the pie chart but in the year 2000 Middle East with North Use synonyms
Africa
is added to with the Use synonyms
population
of 6%.Use synonyms