The graph below shows the amount of money spent on six consumer goods in 4 countries. Explain in details

The graph below shows the amount of money spent on six consumer goods in 4 countries. Explain in details
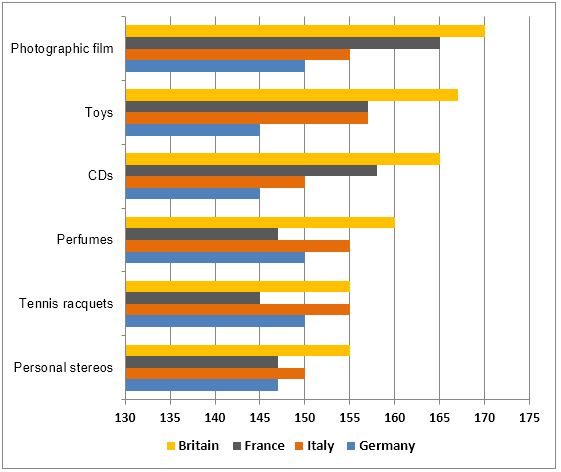
The bar chart provides information on how 4 countries spent on six main expenditures. X-axis gives data on the amount of money spent in
a
Correct article usage
apply
show examples
sterling pounds (thousands)
while
Y-axis
Correct article usage
the Y-axis
show examples
shows six different items. Both Britain and France mostly spent on photographic films which are 170,00 sterling pounds
while
in Italy and Germany, the highest expense was on toys.The amount spent on perfumes and tennis racquets was the same and was responsible for the largest cost in Germany which was 150,000 sterling pounds. Britain's spending on all six consumer goods was either the highest or equal compared to the other 3 countries.
Submitted by vishvaisuranga on

Unauthorized use and/or duplication of this material without express and written permission from this site’s author and/or owner is strictly prohibited. Excerpts and links may be used, provided that full and clear credit is given to Writing9 with appropriate and specific direction to the original content.

Sentences: Add more complex sentences.
Linking words: Don't use the same linking words: "while".
Linking words: Add more linking words.
Basic structure: Write more paragraphs.
Basic structure: Add more body paragraphs.
Common mistake: Your writing should be 150-250 words.
Basic structure: Write more paragraphs.
Vocabulary: The word "amount" was used 2 times.
What to do next:
Look at other essays: