
The information regarding the contrast how much time
spend
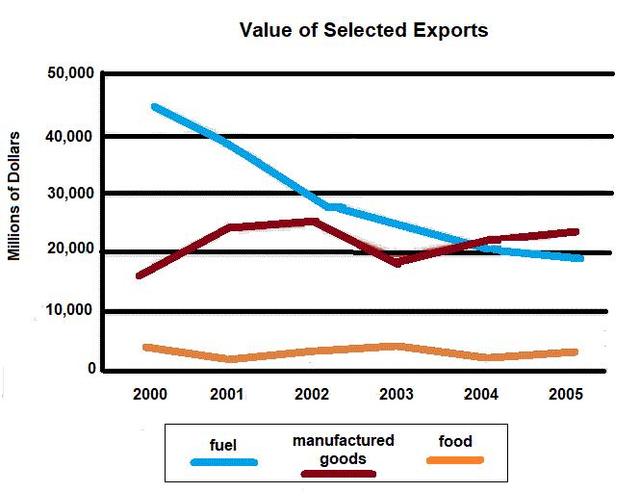
by three different businesses to make a fridge has been illustrated by a line graph in 1990 and 2000.
Change the form of the verb
spent
Overall
, it can be inferred that Linking Words
company
C produces the least refrigerator the other two, Use synonyms
while
Linking Words
company
A shows high production of the fridge.
At a first glance, it can be clearly seen that Use synonyms
company
A produces refrigerators above 40,000 in 2000 and 2001. Use synonyms
After
Linking Words
this
, it frequently goes down to less than 30,000 in 2002. Linking Words
Next,
it produces around 20,000 in 2005. Linking Words
Then
, Linking Words
company
B make less than 20,000 fridges in 2000. Gradually it increases in 2002 and reached 25,000 Use synonyms
then
, again decreases in 2003.
Moving Linking Words
further
, Linking Words
company
C manufacture only 2000 fridges in 2000. Use synonyms
Then
, Linking Words
its
declined to 1000 in 2001. Correct pronoun usage
it
Then
, it escalate to 2000 in 2003. Later, it go down to 500 in 2004. In 2005 it produces just 400 refrigerators.Linking Words