
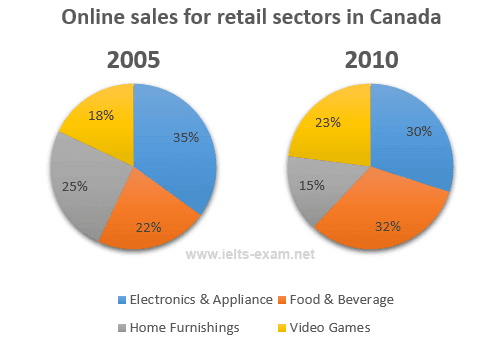
A glance at the two pie graphs provided reveals the percentage of Canadian selling on the internet market in terms of four parts in 2005 and 2010.
Overall
, Linking Words
it is clear that
online buying behaviours had been reshaped, and people purchased different kinds of things in 2019 and 2020. Linking Words
Also
, xx and xx experienced an upward trend Linking Words
while
clothing and xx showed an opposite direction.
In the year of 2019, the rate of clothing was by far the highest, at 38%. Followed by the figure for home and kitchen was over a quarter, at 29%. The other two sectors()were both lower than 20%.
Linking Words
However
, in 2020, dramatic growth showed in the electronic sector, which held the largest part of these categories, increasing to 45%, compared to the date of 2009, almost rising by 20%. Meanwhile, the number of clothing sales, and home and kitchen suffered a significant decrease, to only 22% and xx% respectively.Linking Words