
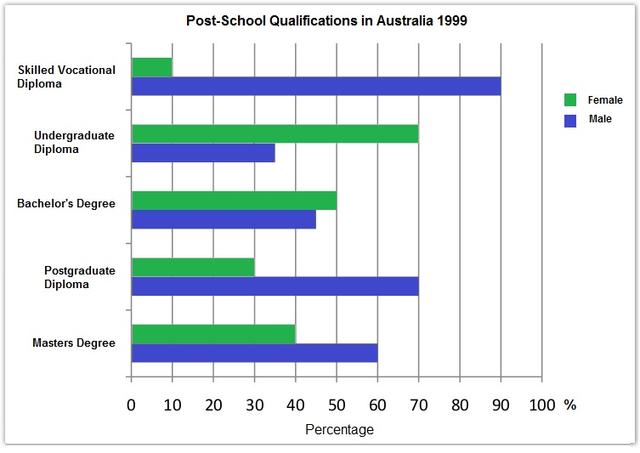
The bar chart provided reveals the proportion of Australian males and females who held the qualifications in terms of different educational levels in 1999.
Overall
, the majority of females got a skilled vocational diploma compared to the least of men. In terms of men, the highest percentage was Linking Words
showed
in the undergraduate degree. Wrong verb form
shown
Furthermore
, the number of women who acquired high degrees(graduate and master's degree) were larger than their counterpart.
Linking Words
It is clear that
the rate of women with a skilled vocational diploma was by far the highest, at over 90%, which was nine times higher than their counterparts(only around 10%). Another apparent feature for females, was 70% of the post-degree degree, compared to 30% of males, almost rising by a half per cent.
Linking Words
However
, in terms of undergraduates, the figure for men(above 70%) experienced twice higher as their counterparts(35%). Linking Words
By contrast
, the comparison of the two genders with bachelor's degrees was not significant, with xx% and xx% respectively.Linking Words