
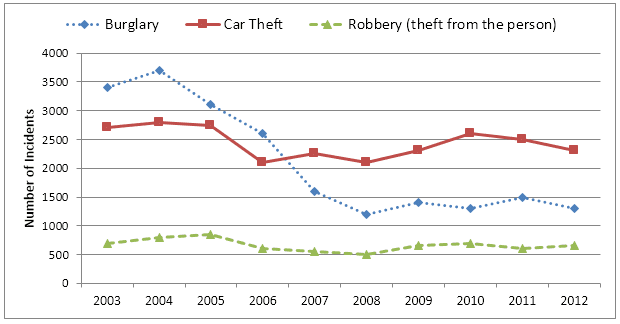
The given line graph show about the crimes that are taking place in an urban city which is situated in the centre of Newport city in the year of 2003 to 2012.
Overall
, Incidents are in thousands, they face fluctuations throughout given periods of time.robbery faced a slight change as compared to others.
In the urban areas Linking Words
crime
was at its peak between 2003 and 2004.It was around 3500 which was the highest Use synonyms
crime
rate in those years.Use synonyms
However
, after all of that rating gradually decreased.In the given time it faced stability after it Linking Words
also
faced small change.on the flip side, Robbery was the lowest Linking Words
crime
rate in the city throughout the years. At ,first it was a little under 700, till the Use synonyms
last
period Linking Words
this
remained the same.
The other phase of Linking Words
crime
is car theft, which faced an upward and downward trend.In the starting period of , the time it was roughly 2700, which was the second-highest Use synonyms
crime
rate.Admittedly, there was a difference in Use synonyms
crime
in the rest of the years.Use synonyms