
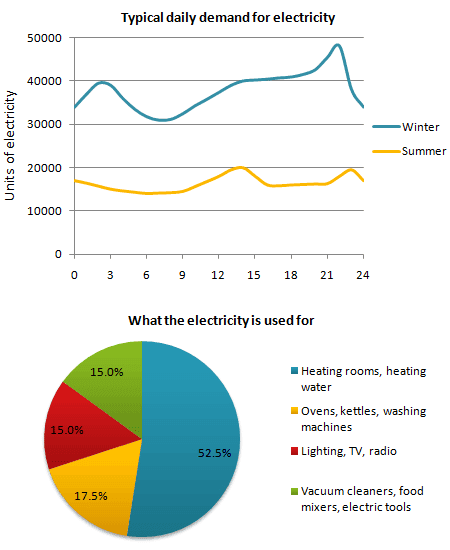
The graphs provide information on the daily usage of electricity in a household in winter and summer and the comparison based on categories of utilisation.
Overall
, the highest consumption was seen in winter, which rose up to 40000 units in comparison with 20000 units in summer. The majority of the power was consumed for heating rooms and water.
In winter the demand for electric current rose from 35000 to about 5000 units, Linking Words
however
by 24 hours it dropped back to the starting level. Linking Words
Whereas
, in summer, though there was fluctuation the rate remained around 15000 to 20000.
The majority of power was consumed by Linking Words
warming
room and water, which was about 52.5%. Whilst, the lowest proportion was used for lighting, TV, radio, Correct article usage
the warming
along with
Linking Words
vaccum
cleaners, food mixers, and electric tools, which constitute about 15% Correct your spelling
vacuum
percent
each. Meanwhile, Change the spelling
per cent
oven
, Fix the agreement mistake
ovens
kettle
and washing Fix the agreement mistake
kettles
machine
constitute 17.5 Fix the agreement mistake
machines
percent
of the Change the spelling
per cent
overall
electricity usage.Linking Words