
This
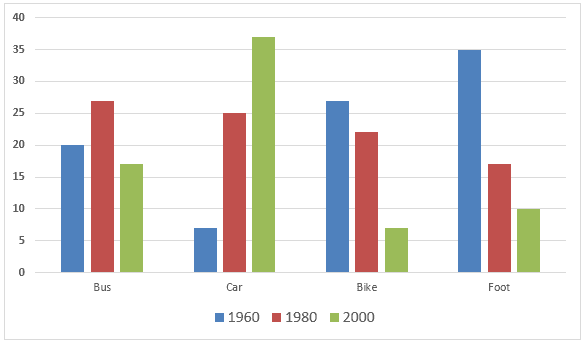
bar chart gives us pieces of data about the different means of transportation for people going to and returning from their work in a European city in 1960, 1980 and 2000.
Linking Words
Overall
it appears that through decades, the favourite means of transit wasn't the same to travel to work. Linking Words
For instance
, Linking Words
while
bike and foot were the most popular in 1960, both modes in 2000 were the less used.
Indeed, only 7% and 10% used bike and foot to travel to work in 2000 Linking Words
whereas
it was more than 25 % and 35 % of people who used these means of shipment 40 years earlier. Linking Words
Conversely
, the car was used by 7% of people in the 1960s Linking Words
while
the rate of car use considerably exploded by 17% in 1980 and Linking Words
until
30% in 2000 to reach a peak of 37% of users. Change preposition
by
Finally
, the bus is the only mode of transport which remained rather importantly used over these 4 decades with 17% of users minimum in 2000 and until 27 % in 1980.Linking Words