
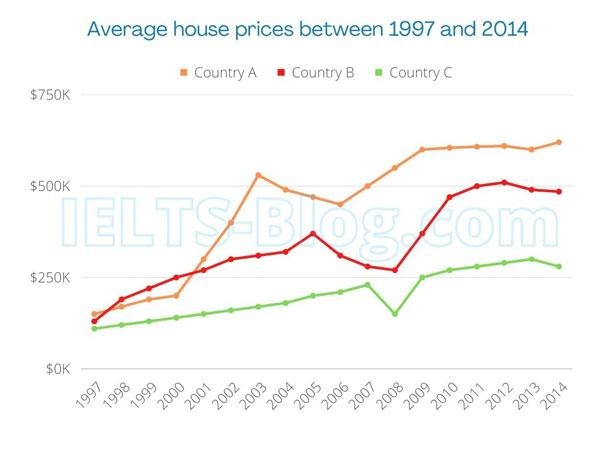
the line graph provides information about the cost of houses in 3 particular nations from 1997 to 2014.
overall
, the average house Linking Words
price
in all surveyed countries followed an upward trend throughout the period. remarkably, the figure for Use synonyms
country
c headed the list with a significant increase.
turning to the detail, the Use synonyms
price
of houses in Use synonyms
country
c Use synonyms
initially
grew from roughly $100 to $150 in 1991Linking Words
,
and Remove the comma
apply
then
recorded a dramatic increase to over $500 until 1993, after which Linking Words
this
category witnessed a slight drop in 1996. Linking Words
at the end
of the period, the house Linking Words
price
in Use synonyms
country
c hit its peak of approximately $600. the cost of houses in Use synonyms
country
A Use synonyms
also
shot up during the given time, but more steadily than in the aforementioned nation, rising from $100 in 1991 to $250 in 1997 before experiencing a considerable drop in 1998 and ending at $240.
Linking Words
in addition
, the house Linking Words
price
in Use synonyms
country
b followed a mounting trajectory from 1991 to 1995, increasing by roughly $100. Use synonyms
however
, between 1996 and 1998, there was a remarkable fall in Linking Words
this
figure. after that, a recovery was recorded Linking Words
at the end
of the period, finishing with approximately $ 500.Linking Words