
This
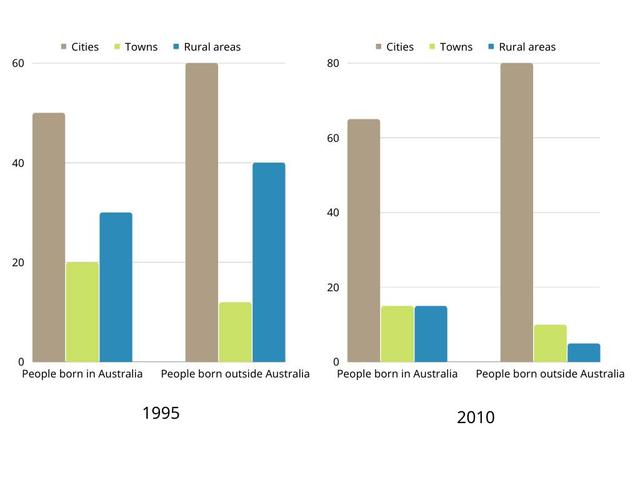
bar chart depicts some modifications in the proportion of Australian Linking Words
people
Use synonyms
and
who were born in foreign nations living in urban, countryside and towns from 1995 to 2010. It's clear from the graph that the most percentages of accommodation are in Correct word choice
apply
cities
for Australian Use synonyms
people
and Non-Australian.
Use synonyms
According to
what is shown, the Linking Words
people
who were born outside Use synonyms
Australia
have various percentages during these years. We can see in 1995 the lowest Use synonyms
percentage
of residents which they are living in town and countryside residents represented 40 per Use synonyms
cent
and in Use synonyms
cities
shows the biggest Use synonyms
percentage
which is 60 per Use synonyms
cent
. Use synonyms
While
in 2010 the Linking Words
percentage
of city residents remained increasing soared to about twenty per Use synonyms
cent
and the town has no change that match. Use synonyms
While
the Linking Words
people
born in Use synonyms
Australia
have not changed a lot during Use synonyms
this
decade and a half. We can see in 1995 the proportion of rural areas accommodation is about 25 per Linking Words
cent
and in towns represent 20% Use synonyms
also
Linking Words
people
in Use synonyms
cities
shows about 45%. After nearly 15 years the Use synonyms
percentage
of Use synonyms
people
in Use synonyms
cities
increased slightly by about a quarter and the percentages of the countryside, and towns accommodation have the same per Use synonyms
cent
which is about 18 per Use synonyms
cent
.
Use synonyms
To sum up
, we could say that the ratio of Linking Words
people
who were born in Use synonyms
Australia
has not changed a lot in numbers during these years Use synonyms
Although
the Linking Words
people
Who were born outside Use synonyms
Australia
have a huge difference as we can see in the graph.Use synonyms