
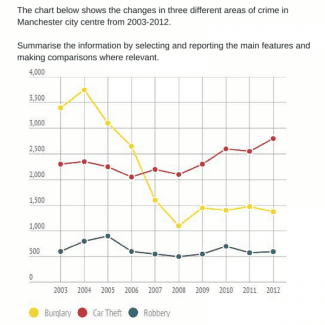
The line graph provides information about the recorded crimes in Manchester city centre and the changes between the years 2003 to 2012.
Overall
, Linking Words
it is clear that
burglary is the highest committed crime, Linking Words
Linking Words
however
it dropped significantly and was surpassed by cases of car theft in the middle of the study. Meanwhile, robbery is the lowest and remained constant throughout the years.
In the year 2003, burglary is the highest crime rate in the city of Manchester with above 3000 and continue to rise in the next year reaching a peak of approximately 3800. Add a comma
,however
Then
, the figure fell drastically reaching Linking Words
to
the lowest point of just above 1000 in 2008. The number slightly recovered in the following years until 2012 with roughly 1500.
Change preposition
apply
Although
car theft at the beginning is the second highest case with an estimated 2300, albeit after 2006 it became the Linking Words
commonly
committed crime by the people in Manchester and steadily rose ending just below 2300. Correct quantifier usage
most commonly
On the other hand
, the robbery case in the city shows mild changes in 9 year period with just under 1000, which is the lowest.Linking Words