
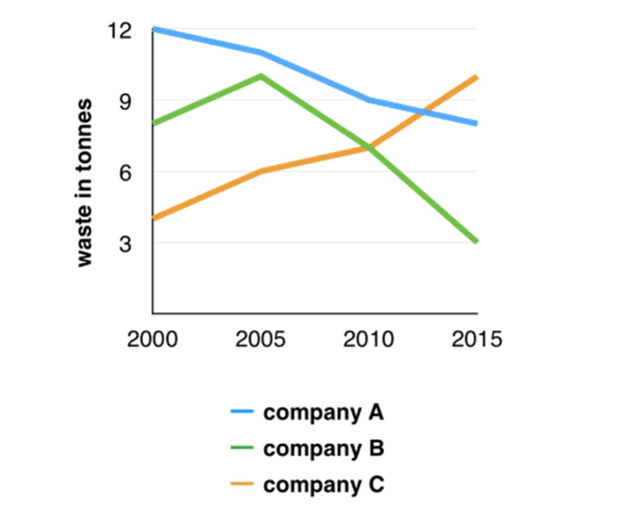
The graph illustrates the quantity of
waste
generated by three companies within 15 years.
Use synonyms
overall
, Linking Words
it is clear that
during 15 years there is a decrease in producing Linking Words
waste
products by Use synonyms
company
A Use synonyms
while
there is a Linking Words
dramatically
increase can be seen in Change the adverb
dramatic
company
Use synonyms
C
.
At the beginning of the period Use synonyms
company
A created above 2000 Use synonyms
tonnes
Use synonyms
Use synonyms
waste
which is much more than the other two companies but in ,2015 they produced less than 9 Change preposition
of waste
tonnes
which Use synonyms
is
lower than Change the verb form
are
company
Use synonyms
C
which produced nearly 9.5 Use synonyms
tonnes
of Use synonyms
waste
.
The graph for Use synonyms
company
B fluctuates, as it is given at the beginning of the period there was a Use synonyms
grown
from 6 to 9.5 tones per year but suddenly it declined sharply as much that Replace the word
growth
at the end
of ,2015 it produced just 3 Linking Words
tonnes
per year Use synonyms
that is
3 times lower than Linking Words
group
Use synonyms
c
and 6 tones lower than Use synonyms
group
A.
In the end ,Use synonyms
group
Use synonyms
C
produced more than others Use synonyms
while
Linking Words
Group
A produced more than Use synonyms
Group
A.Use synonyms