
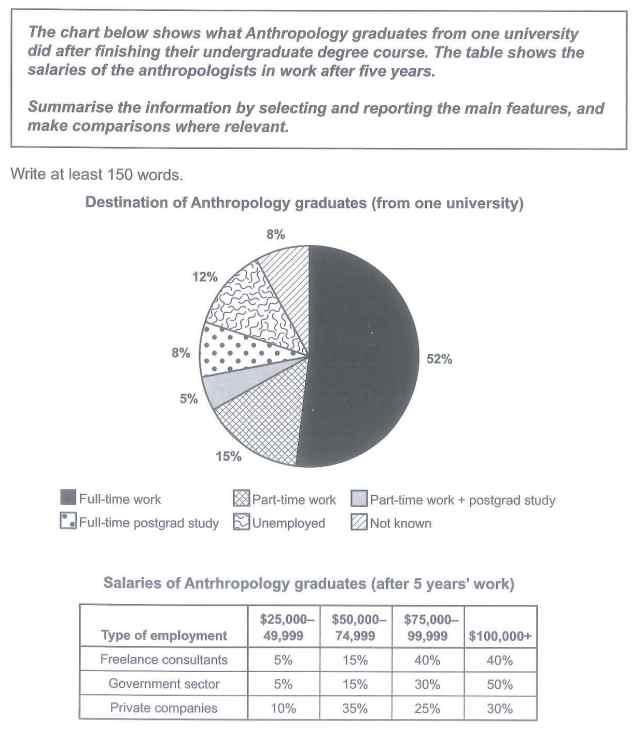
the given pie chart and table illustrate the destination of anthropology graduates from a particular university after their graduation and their salary of them.
according to
the,chart the chart a little more than fifty per cent were able to find a full-time job , Linking Words
while
only 5% of them could have a part-time job and continue their postgraduate study. the part-time workers and unemploy show approximately a similar percentage Linking Words
that is
15% and a little less than it. both the full-time postgraduate study and unknown show exactly a little less than ten per cent.
Linking Words
besides
these, the table shows a range of salaries of anthropology graduates after 5 years. in the part of salaries,the two lowest items under $50,000 are freelance consultants and the government sector at 5% Linking Words
while
they have the two highest incomes over $100,000 at 40% and one-second per cent,in ,addition Linking Words
although
private companies have a high
a number of wages between $25,000 and $74,999, it has the lowest incomes over $75,000 and $100,000 that are a quarter % and 30%.
Linking Words
overall
we can see that the full-time job has the highest number of interests compared to the part-time and postgrad study which is the lowest. Linking Words
Moreover
,Linking Words
Linking Words
however
the government sector has the biggest number of incomes over $100,000, it Add the comma(s)
,however
also
has the lowest ones under $50,000Linking Words