
The given pie charts
gives
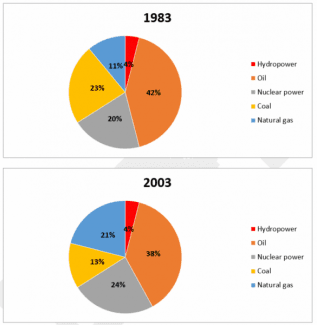
data about the proportions of energy produced in a country from 1983 to 2003.There are five powers.They are Change the verb form
give
hydropower
,Use synonyms
oil
,Use synonyms
nucleat
power , coal and Correct your spelling
nuclear
nafural
gas.
Looking at the graph as a whole,Correct your spelling
natural
oil
was the most Use synonyms
use
energy between 1980 and 2003.Replace the word
used
On the other hand
, Linking Words
hydropower
was the lowest from 1983 to 2003.
In detail,Use synonyms
hydropower
was no change at 4% Use synonyms
Linking Words
this
Change preposition
in this
priode
, and Correct your spelling
period
also
nuclear power remained all most constant at around 22% from 1983 to 2003.Linking Words
On the other hand
, the proportion of coal Linking Words
decrease
Wrong verb form
decreased
at
10% between 1983 and 2003,Change preposition
by
Linking Words
then
the rate of Correct word choice
and then
hydropower
down Use synonyms
at
4% from 1983 to 2003.In constant,the proportion of natural gas Change preposition
to
increase
Wrong verb form
increased
at
10% until 2003.As you can see, Change preposition
by
the
Correct article usage
apply
oil
is the most Use synonyms
use
in Replace the word
used
the
all,and Correct article usage
apply
also
Linking Words
the
Correct article usage
apply
hydropower
is the Use synonyms
proporption
of lowest in Correct your spelling
proportion
the
all.So the rate of Correct article usage
apply
hydropower
and Use synonyms
oil
Use synonyms
Add a missing verb
was different
different
at around 36% in 1983 and 2003.Replace the word
differed