
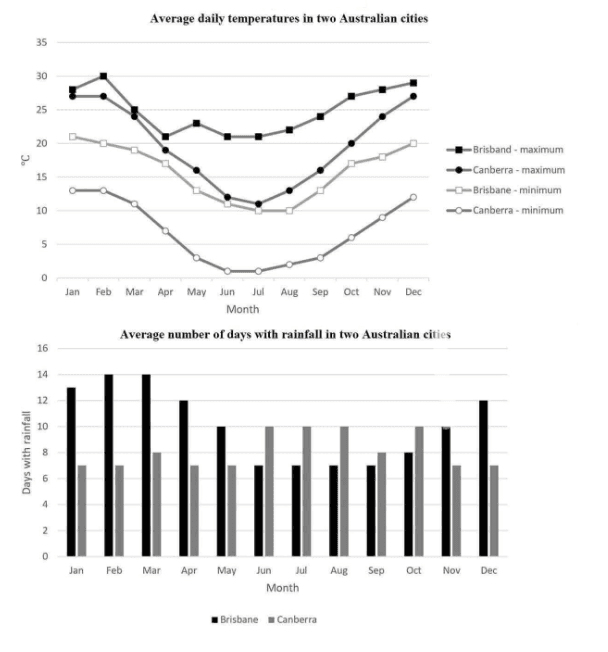
The line graph shows the daily amplitude temperature in two Australian cities, Brisbane and Canberra. Meanwhile, in the other graph, we may appreciate the number of rainy
days
in each month in both cities as well.
Use synonyms
Overall
, we may infer each city experiments Linking Words
different
precipitation regimes, depending on the season they are in. In Brisbane, during the summer season, rainy Change preposition
with different
days
increase, Use synonyms
while
in Canberra Linking Words
this
tendency seems to be turnback.
A closer look at Brisbane shows us that during the months of January, February, and March the daily amplitude is minimum, variating between 1Linking Words
°C
to 5Use synonyms
°C
, and there is a high level of rainy Use synonyms
days
in each month, between 13 to 14 Use synonyms
days
. Use synonyms
On the other hand
, Canberra has a more significant growth in its daily amplitude during the entire year, achieving a variation between 15Linking Words
°C
to 20Use synonyms
°C
during the winter season, where the rainy Use synonyms
days
in these months are máximun, variating between 10 to 5.Use synonyms