
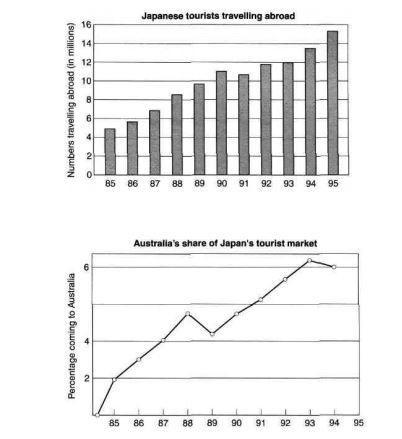
The bar graph illustrates how many Japanese travellers fly overseas during a period of ten years commencing from 1985 to 1995.
Besides
, the line graph depicts the percentage of Japan's tourist market which Australia welcomed in these times.
At first glance, it is recognizable that Linking Words
overall
, the number of Japanese tourists travelling abroad dramatically skyrocketed over these reporting periods, whilst, the rate of these travellers visiting Australia increased.
Looking at the data in more detail, Linking Words
it is clear that
more than 5 Linking Words
million
of the population in Japan travelled to other countries. After half a decade, Use synonyms
this
number approximately doubled, till reached 11 Linking Words
million
in 1990. Use synonyms
However
, there was a gradual decline in Linking Words
this
amount by almost one Linking Words
million
in 1991. In the following years, the proportion of Japanese citizens visiting other nations significantly rose and peaked at moderately below 16 Use synonyms
million
in 1995.
Moving onto the second chart, the Australian territory only received 2% of the total in 1985. Interestingly, a slight rise was noticed in Use synonyms
this
percentage by 3% after four years, Linking Words
then
Linking Words
this
rate decreased in 1989. Since Linking Words
then
, there was an upward trend in Australia's share of Japan's tourist market, till reached its peak at 6 Linking Words
million
in 1995.Use synonyms