
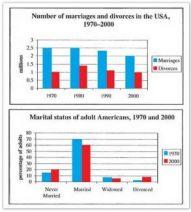
The two bar graphs provide the statistics of marriages and divorces that happened over four decades starting from 1970,
together with
a second one that compared the marital status of adult Linking Words
Americans
between 1970 and 2000.
At a glance, it was observed that there was a gradual fall in the number of marriages between 1970 and 2000. The majority of the Use synonyms
Americans
who were of age were married in both years, but the proportion of single adults was higher in 2000.
In 1970, there were two and a half Use synonyms
million
marriages and one Use synonyms
million
divorces. The marriage rate remained stable in 1980 but fell to 2 Use synonyms
million
by the year 2000. The divorce rate rose to a peak in 1980 at nearly 1.5 Use synonyms
million
and Use synonyms
then
declined back to 1 Linking Words
million
marks from 1990 onwards.
Around 70% of Use synonyms
Americans
remained married in 1970, but Use synonyms
this
figure declined to just under sixty per cent by 2000. At the same time, the proportion of unmarried people and divorcees rose by about 10% in total. Linking Words
In contrast
, percentage of the widowed Linking Words
Americans
was slightly higher in 1970.Use synonyms