
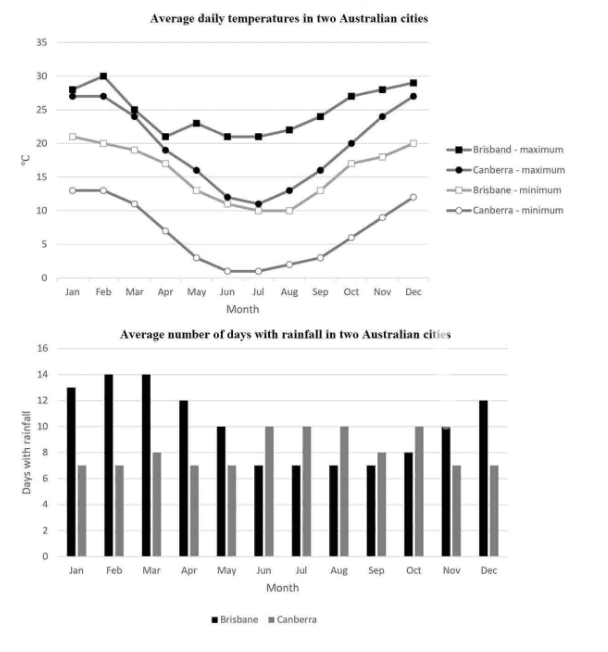
The given graph and chart
presents
data on the typical maximum and minimum daily temperatures in degrees Celsius (°C) Wrong verb form
present
as well as
the typical monthly number of rainy Linking Words
days
for two Australian Use synonyms
cities
.
Use synonyms
Overall
, it can be seen that both graph and chart have fluctuated trends.
Linking Words
According to
the data, there are Linking Words
fluctuated
figures in the average daily Wrong verb form
fluctuating
temparatures
graph. Correct your spelling
temperatures
temperature
Brisbane
has the highest maximum Use synonyms
temparature
in Correct your spelling
temperature
January
, at nearly 30 degrees Celsius, followed by Use synonyms
Canberra
. The Use synonyms
temparatures
of all Correct your spelling
temperatures
cities
mostly drop down in Use synonyms
June
. The minimum temperature of Use synonyms
Canberra
is nearly 0 degrees Celsius in Use synonyms
June
, which is the lowest among all Use synonyms
cities
. Use synonyms
Lastly
, the temperatures in December of all Linking Words
cities
Use synonyms
is
nearly the temperature in Correct subject-verb agreement
are
January
.
Use synonyms
On the other hand
, the average number of Linking Words
days
with rainfall in Use synonyms
Brisbane
fluctuates. There are 12 Use synonyms
days
in Use synonyms
January
and slowly increases to 14 in February, Use synonyms
then
, slightly decreases to 7 Linking Words
days
from Use synonyms
June
to September. Use synonyms
Moreover
, the figures Linking Words
of
Change preposition
for
Canberra
is as Use synonyms
same
as Correct article usage
the same
Brisbane
. Use synonyms
However
, it is clearly seen that Linking Words
Canberra
has average Use synonyms
days
with rainfall lower than Use synonyms
Brisbane
, Use synonyms
strating
at 7 Correct your spelling
starting
days
in Use synonyms
January
and Use synonyms
increases
to 10 Wrong verb form
increasing
days
in Use synonyms
June
, Use synonyms
then
, Linking Words
decreases
to 7 Wrong verb form
decreasing
days
in December, as same as Use synonyms
Use synonyms
January
.Change preposition
in January