
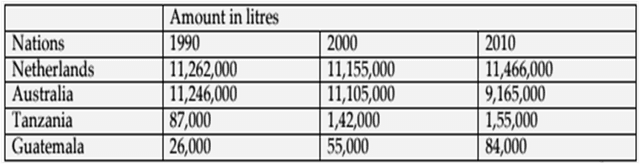
The provided table illustrates the
milk
production in a year in four countries (Netherlands, Australia, Tanzania, Guatemala) in 1990, 2000 and 2010. The Use synonyms
amount
of Use synonyms
milk
counted in Use synonyms
litres
.
At the onset, Use synonyms
it is clear that
the highest Linking Words
amount
of Use synonyms
milk
, over the years, was produced by the Netherlands, and the lowest Use synonyms
amount
was produced by Guatemala.
Eventually, the Netherlands produced the maximum Use synonyms
amount
of Use synonyms
milk
through the years from 11.262.000 Use synonyms
litres
in 1990 to 11.466.000 Use synonyms
litres
in 2010, with a slight fluctuation to 11.155.000 Use synonyms
litres
in 2000. Use synonyms
Likewise
, Tanzania and Guatemala showed a growing tendency from 87.000 in 1990 to 1.55.000 Linking Words
litres
in 2010 and 26.000 Use synonyms
litres
in 1990 to 84.000 Use synonyms
litres
in 2020 perspectively.
Australia’s Use synonyms
milk
production, Use synonyms
otherwise
, went down from 11.246.000 Linking Words
litres
in 1990 to 9.165.000 Use synonyms
litres
in 2010.Use synonyms