
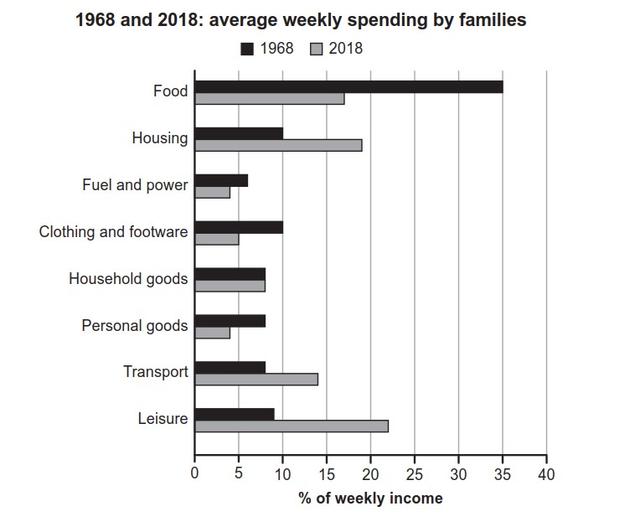
The given bar graph outlines a family's outcome in a week for several types of daily needs (categorized by
food
, housing, electricity, outfit, household goods, personal goods, transportation, and education) compared between 1968 and 2018. The data is measured by the percentage of weekly income.
Use synonyms
Overall
, spending on Linking Words
food
in 1968 was the highest compared to spending in other fields in that year and spending the least on electricity. Meanwhile, in 2018, families set aside more of their money for educational purposes and personal goods and fuel power were the lowest.
In 1968, family needs seemed quite stable with an average of 7% spent on each category. As per the diagram, Use synonyms
food
spending hit a peak of 35% in that year. Use synonyms
However
, expenses in the fuel and power sectors have a ratio of 1 :Linking Words
6
respectively.
Correct word choice
and 6
On the other hand
, in 2018, the ratio of all needs is seemingly lower compared to 1968’s data. It is Linking Words
also
interesting to note that the transportation, Linking Words
food
and housing category have Use synonyms
a
slightly different number which is less than 5% each. It is seen that spending in the field of leisure reached its highest point by almost a quarter.Correct article usage
apply