
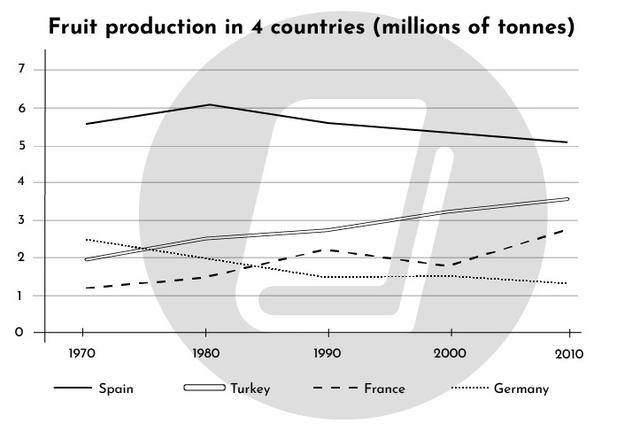
The chart illustrates how much
fruit
was produced in four nations between 1970 and 2010.
Use synonyms
Overall
, it is noticeable that the amount of Linking Words
fruit
produced in Spain and Germany was a downward trend Use synonyms
while
France and Turkey saw an upward trend. Linking Words
Additionally
, Spain was the largest Linking Words
fruit
production during the period.
In the first decade, the data on Use synonyms
fruit
manufacture in Spain started at 5.5 Use synonyms
million
Use synonyms
tonnes
Use synonyms
then
Linking Words
this
figure peaked at 6 before falling significantly to 5 Linking Words
at the end
. Linking Words
While
the amount of Linking Words
fruit
production in Turkey stood at 2 Use synonyms
million
Use synonyms
tonnes
after that, there was the highest point of 3.5 until 2010.
In the twenty years, the amount of Use synonyms
fruit
production in France started at almost 1 Use synonyms
million
Use synonyms
tonnes
Use synonyms
after
Linking Words
this
figure increased dramatically to 2.25. Followed by a fluctuation of nearly 2 and approximately 3 from 1990 to 2010. Linking Words
In contrast
, the data for Linking Words
fruit
manufacture in Germany stood at 2.5 Use synonyms
million
Use synonyms
tonnes
after decreasing considerably to nearly 1.5 in 2010Use synonyms