
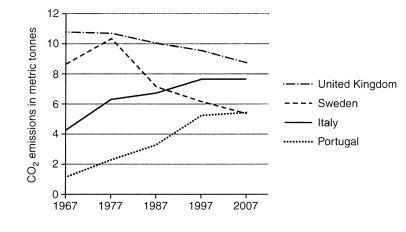
The line graph illustrates changes in the average
carbon
dioxide emissions per capita in the United Kingdom, Use synonyms
Sweden
, Italy, and Portugal from 1967 to 2007.
As can be seen from the graph, the UK and Portugal’s Use synonyms
carbon
footprint witnessed a rise towards the end of the period Use synonyms
whereas
those of Italy and Linking Words
Sweden
declined. Interestingly, both Use synonyms
Sweden
and Portugal were equal by 2007.
Use synonyms
To begin
with, the average Italian’s Linking Words
carbon
footprint almost doubled throughout the time span, when it climbed steadily from around 4 Use synonyms
tonnes
in 1967 to approximately 8 Use synonyms
tonnes
in 2007. Meanwhile, despite emitting much lower greenhouse gas Use synonyms
initially
(around 1 tonne), the Portuguese underwent a drastic increase later on and ended up at almost 6 Linking Words
tonnes
Use synonyms
at the end
of the timespan.
Linking Words
On the other hand
, the countries that experienced a decline in Linking Words
carbon
emissions were Use synonyms
Sweden
and the United Kingdom. Surprisingly, their numbers are exceptionally high at the beginning at roughly 9 and 11 Use synonyms
tonnes
respectively. Use synonyms
While
the UK people managed to lessen their Linking Words
carbon
footprint continuously to just around where the Swedish was in 1967, the Swedish’s figure hit a high of 10 Use synonyms
tonnes
around 1977 before decreasing and was equivalent to the number of the Portuguese in 2007.Use synonyms